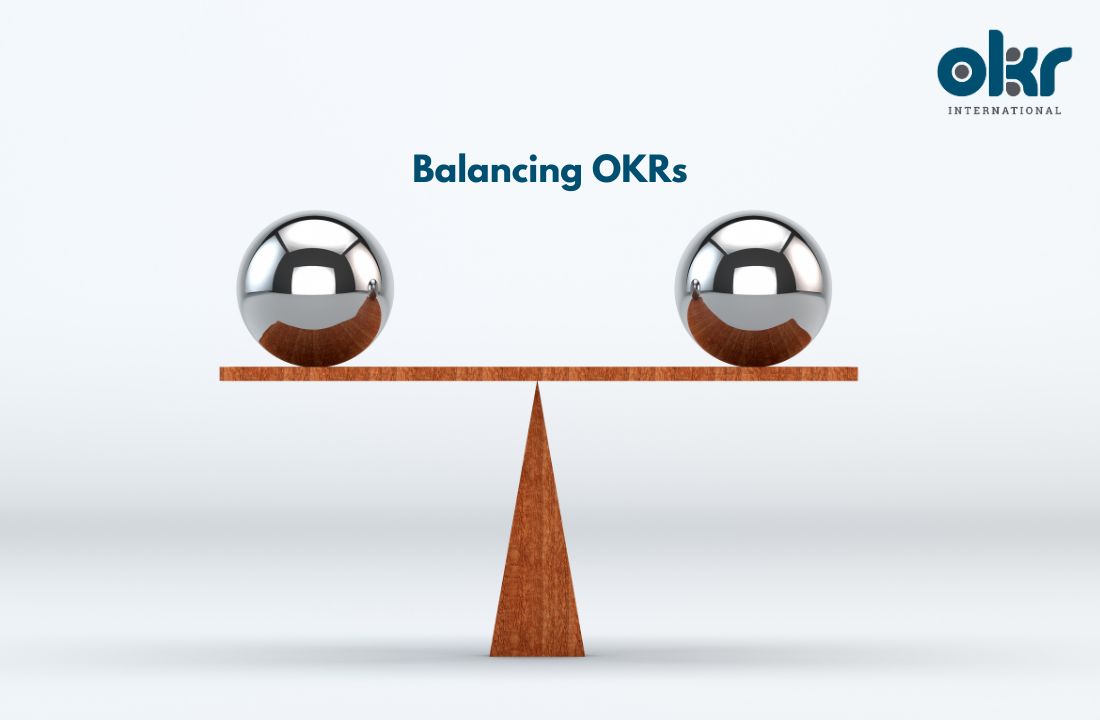
Creating the perfect mix whilst Balancing OKRs
Balancing OKRs is about getting your success measures truly aligned with the Objective at hand. How you measure success is a key determinant of how successful you will eventually get in your OKR planning & implementation.
Efficiency vs. Effectiveness
A company’s bottom line dictates how efficient it is with its spending and managing its costs of operations. Top line, on the other hand, indicates how effective a company is at generating sales and revenue and does not consider operating efficiencies which could have a dramatic impact on the bottom line.
Effectiveness Measures
Success measures to increase top line growth may include increase in sales & revenues, new products, new markets, mergers & acquisitions or increasing market share.
Efficiency Measures
Bottom line related success measures, alternatively, may include efforts to reduce expenses. This may be achieved by enhancing production, product improvement, decreasing cost of goods sold (COGS), reducing cost of raw materials, increasing return on advertising spends (ROAS), reducing cost of customer acquisition, improving return on assets (ROA) or improving employee productivity through learning & development.
Conclusion
Ergo, whilst measuring success, it’s critical that we maintain a healthy balance between Key Results that are both efficient and effective in nature. Too much skew towards any one dimension may render an undesirable outcome. This holds true for Key Results at a strategic level as well as tactical levels.
Example 1
Objective: Be a market leader in the product category
Key Result 1: Increase Net Sales from $20m to $45m (period may vary).
Key Result 2: Increase Market Share from 45% to 55%.
Key Result 3: Improve Operating Margins from 45% to 60%.
Note: How KRs 1 & 2 are focused on measuring success by improving top lines. And KR 3 is focused on balancing this by measuring success through improving the bottom-line.
Example 2
Objective: Be the number one app in the online food delivery industry.
Key Result 1: Increase Average Revenue Per User (ARPU) from $15 to $30 (period may vary).
Key Result 2: Grow Active Users from 25m to 50m.
Key Result 3: Reduce Churn Rate from 57% to 10%.
Key Result 4: Reduce Cost Per Acquisition from $3.5 to $1.5
Note: How KRs 1 & 2 are focused on measuring success by improving top lines. And KR 3 & 4 is focused on balancing this by measuring success through improving the bottom-line.
Author: Nikhil K Maini, Founder & MD – OKR International


